Belgium-electricity-import-inference-engine
A method to infer the make-up of Belgian electricity imports
Motivation
What Does Belgium Really Import?
Belgium is structurally interconnected with its neighbours and frequently imports electricity. Headlines often state that “Belgium imports record amounts of electricity”, but they do not clarify what kind of electricity this actually is. Is Belgium importing:
- nuclear electricity from France?
- gas-fired electricity from the Netherlands?
- coal-fired electricity from Germany?
- or hydroelectricity dispatched opportunistically?
Answering this question is not trivial. Electricity flows are simultaneous, bidirectional, and shaped by market coupling across Europe. Belgium is not only an importer, but also regularly a transit country, with power flowing through its grid between neighbouring zones.
On social media, many people have strong opinions on these types of news articles or the make-up of these import flows, without actually having any clue on how they are actually made up. I wanted to get some real numbers, so I started crunching some data. The goal of this little project is not to reconstruct the European market dispatch in detail, but to make a transparent, defensible attempt to answer a simpler but policy-relevant question: What does the electricity Belgium imports from its neighbouring countries most likely consist of?
This document is intended to document my methodology. See some results here or here.
About the author
I am a postdoctoral researcher at the Energy & Systems Lab of Ghent University, working on electricity systems, markets, and energy policy analysis.
This repository reflects my interest in transparent, data-driven approaches to understanding power system behaviour.
You can find more of my work or get in touch via:
Feel free to reach out through any of these channels if you are interested in my data analysis or research activities.
Why the Import Mix Must Be Inferred
Electricity markets differ fundamentally from other commodity trade. Electricity imports:
- cannot be traced to individual power plants,
- flows may enter Belgium and leave again immediately,
- generation in neighbouring countries may be driven by demand elsewhere.
Reconstructing true dispatch would require full bid stacks, Euphemia, flow-based constraints, and counterfactual simulations, none of which are publicly available. This means there is no single “correct” import mix. Any answer must be an inference, based on assumptions. The objective is therefore approximation, not reconstruction. Below I discuss the methodlogical framework/pipeline I created for this.
Step 1 — Inferring Marginal Technologies per Country
A country does not import the average electricity mix of another country. When electricity demand changes, not all power plants respond equally:
- some plants run almost continuously,
- others are adjusted up and down to balance the system.
When demand in one country increases, exports are supplied by the power plants in the exporting country that can still adjust their output at the margin (the so-called marginal unit), not by all generators equally. The technologies that respond to short-term changes are the ones that:
- determine prices,
- enable exports,
- and are relevant for questions about imports and dependency.
Identifying these marginal technologies is therefore essential to understand which types of generation are actually activated by imports. This is not trivial. I designed a method that tries to detect this based on ramping behaviour (“which powerplants increase output when demand increases?”), with a wholesale price-based inference as fallback.
Step 1a — Ramping-Based Detection
At each quarter hour, (changes in) generation by the different power plant technologies is observed. The marginal technology is approximated as the technology that increases output when demand rises.
For technology i, the change in output between two consecutive quarter-hours is defined as:
\[\Delta G_i(t) = G_i(t) - G_i(t-1)\]Only positive ramps are considered relevant for marginal supply:
\[\Delta G_i^{+}(t) = \max\bigl(\Delta G_i(t),\, 0\bigr)\]Technologies with the largest significant positive ramps are candidates for marginality. Small fluctuations are filtered using minimum ramp thresholds to avoid noise.
The intuition is simple:
- technologies that increase output are responding to additional demand,
- technologies that do not change output are inframarginal at that moment.
Eligibility rules
Not all technologies should be treated equally, even if they ramp:
- Wind and solar ramp due to weather, not market demand.
- Nuclear may ramp, but usually remains inframarginal and price-insensitive.
- Storage can ramp sharply but only in specific price regimes.
- Hydro reservoirs can be dispatched strategically.
Therefore, country-specific eligibility rules are applied:
- France: special treatment of reservoir hydro and nuclear
- UK & Netherlands: gas-dominated marginality
- Germany: regime switching between lignite, coal, and gas
The result of this step is a detected marginal technology for each country and quarter hour when such detection is possible. See the per-country assumptions below.
Step 1b — Price-Imputed Fallback
In many intervals:
- generation is relatively flat,
- multiple technologies move slightly,
- or the marginal unit is already running and does not ramp visibly.
In these cases, ramp-based detection alone is insufficient, and I inferr marginality from price regimes. Prices are grouped, per country, into low, mid, high, and scarcity regimes. For each regime and country, a plausible merit order is defined based on cost structures and historical dispatch behaviour. See assumptions below. This fallback is used only when ramp-based detection yields no clear result.
Step 2 — Constructing an Inferred Marginal Stack
Export volumes frequently exceed the ramp of a single technology. Therefore, a marginal stack is constructed:
- detected marginal technologies (ordered by ramp size),
- followed by price-imputed technologies ordered by plausibility and availability.
This stack acts as a proxy merit order (or a reverse one, if you will), inferred from observable data rather than bids.
Step 3 — Allocating Cross-Border Exports
At each quarter hour, exports to Belgium (if present) are allocated sequentially across the marginal stack of each country until the observed physical flow (export) volume is fully attributed. In laymans terms: if the observed export from Country A to Belgium cannot be supplied by the detected marginal technology in country A, the second-to-marginal tech is used, then the third etc.
Step 4 — Net Imports and Transit
Belgium is often a transit country: we import from country A and export to country B. To avoid double counting, the analysis focuses on net imports.
Belgium’s net import position is defined as the difference between total imports and total exports, bounded below by zero:
\[\text{Net Import}_{\text{BE}}(t) = \max\left( \sum_c \text{Import}_{c \rightarrow \text{BE}}(t) - \sum_c \text{Export}_{\text{BE} \rightarrow c}(t), \; 0 \right)\]Two metrics are reported:
- an accounting-based net import mix,
- a transit-corrected marginal attribution proxy.
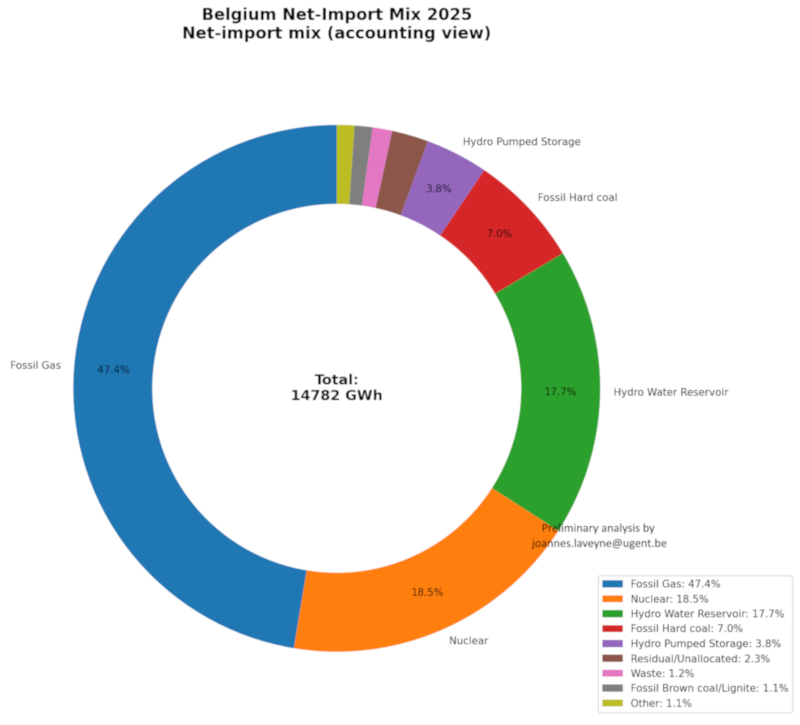
Metric 1 — Net-Import Mix (Accounting View)
What types of electricity did Belgium rely on abroad, on net?
This metric:
- weights neighbouring countries’ inferred export mixes,
- scales them to Belgium’s net import volume,
- makes no claim about causality (“which country initiated the export, Belgium or a country Belgium is exporting to?”)
It is an accounting view using marginal-stack attribution.
Metric 2 — Marginal Import Attribution (Causal Proxy)
Which technologies were most likely activated because Belgium was a sink, not a transit zone?
Belgium is a transit zone. This means import to Belgium (and ramping up of a marginal tech in the exporting country) could be triggered by import from Belgium by another country. E.g. a gas plant in France could be starting up to provide import to Belgium, but in reality it is because of increasing demand in Germany with Belgium just being used as passthrough.
To account for Belgium’s role as a transit country, a simple transit indicator is defined as:
\[\text{Transit Ratio}(t) = \frac{ \min\bigl(\text{Imports}(t),\, \text{Exports}(t)\bigr) }{ \max\bigl(\text{Imports}(t),\, \text{Exports}(t)\bigr) }\]This ratio approaches 1 when imports and exports are similar (transit-dominated), and approaches 0 when Belgium is clearly a net sink or source.
A causal weight is then derived as:
\[w_{\text{causal}}(t) = 1 - \text{Transit Ratio}(t)\]Metric 1 is multiplied by this weight to downweight transit-heavy intervals.
What I try to do here is assign causality to import. But this is very tricky to do with the limited public data at my disposal. This metric is therefore explicitly labelled a proxy for causality, not a counterfactual result.
Assumptions
General Technology Classifications
Non-Dispatchable / Exogenously dispatched (e.g. by weather conditions) (excluded from candidates):
- Wind Onshore, Wind Offshore, Solar
- Hydro Run-of-river and pondage, Marine
- Other renewable, Geothermal
Typically Inframarginal:
- Nuclear (country-specific gating)
Dispatchable Candidates:
- Hydro Water Reservoir, Hydro Pumped Storage
- Fossil Gas, Fossil Hard coal, Fossil Brown coal/Lignite
- Fossil Coal-derived gas, Fossil Oil, Fossil Oil shale, Fossil Peat
- Biomass, Waste, Energy storage, Other
Country-Specific Logic
France (FR)
Market Characteristics:
- Strategic reservoir hydro dispatch based on opportunity cost
- Large nuclear baseload (typically inframarginal)
- Storage arbitrage in scarcity periods
Detection Logic:
- Storage eligibility: Only in high-price (P >= P70) or scarcity (P >= P90) regimes
- Hydro preference: In high-price hours, prefer Hydro Water Reservoir if its ramp is within 10% of top dispatchable ramp
- Nuclear gating: Strict - only if:
- Nuclear is largest ramp among ALL techs
- No eligible dispatchable exceeds 50% of nuclear ramp (2.0× rule)
- Not in scarcity period
- Storage in scarcity: Prefer storage if it has largest ramp
Price-Regime Imputation Fallback:
- Scarcity (P >= P90): Storage (if online) → Gas → Reservoir → Coal → Nuclear
- High (P70-P90): Reservoir → Gas → Coal → Nuclear
- Low (P <= P30): Nuclear (imputed inframarginal baseline)
- Mid (P30-P70): Gas → Reservoir → Coal → Nuclear
Rationale: Reservoir hydro is strategically dispatched in high-price hours; nuclear is almost never marginal.
United Kingdom (GB)
Market Characteristics:
- Gas-dominated marginality
- Little strategic reservoir hydro
- Simpler merit-order proxy works better
Detection Logic:
- Storage eligibility: Only in high/scarcity price regimes
- No hydro preference: Treat Hydro Water Reservoir as normal dispatchable (rare)
- Nuclear gating: Very strict (even stricter than FR) - only if no eligible dispatchable exceeds 30% of nuclear ramp
- Gas primary: Fossil Gas is primary marginal candidate
Price-Regime Imputation Fallback:
- Scarcity (P >= P90): Gas → Storage → Oil → Coal → Other
- High (P70-P90): Gas → Storage → Coal → Other
- Low (P <= P30): Gas → Nuclear (if present) → Other
- Mid (P30-P70): Gas → Other
Rationale: UK price formation dominated by gas/peakers rather than reservoir hydro.
Netherlands (NL)
Market Characteristics:
- Gas-dominated, similar to UK
- CHP/”Other” may exist but keep simple
- Marginality is stable and usually gas
Detection Logic:
- Storage eligibility: Only in high/scarcity price regimes
- No hydro preference: No special hydro handling
- Nuclear gating: Very strict (if nuclear present)
- Gas primary: Fossil Gas is primary marginal candidate
Price-Regime Imputation Fallback:
- Scarcity (P >= P90): Gas → Storage → Oil → Coal → Other
- High (P70-P90): Gas → Coal → Other
- Low (P <= P30): Gas → Other (do not force nuclear if NL doesn’t have it)
- Mid (P30-P70): Gas → Other
Rationale: Marginality is stable and usually gas; simpler than Germany/France.
Germany (DE)
Market Characteristics:
- Multiple marginal regimes (lignite/coal/gas)
- Strong RES swings
- Dynamic switching between coal and gas
- Nuclear absent
Detection Logic:
- Storage eligibility: Only in high/scarcity price regimes
- No hydro preference: No France-style reservoir preference
- Nuclear gating: None (nuclear not present)
- Coal/lignite priority: Lignite and hard coal can be marginal in mid/low price regimes
Price-Regime Imputation Fallback:
- Scarcity (P >= P90): Gas → Storage → Oil → Hard coal → Lignite → Other
- High (P70-P90): Gas → Hard coal → Lignite → Other
- Mid (P30-P70): Hard coal → Lignite → Gas → Other
- Low (P <= P30): Lignite → Hard coal → Other
Rationale: Germany often has coal/lignite on the margin in mid/low price regimes; gas tends to dominate high/scarcity.
What This Method Can and Cannot Do
What it can do
- provide an informed picture of Belgium’s import dependency,
- support policy and public discussion,
- highlight import exposure to gas, coal, nuclear, and hydro.
What it cannot do
- identify the true price-setting unit,
- trace physical power flows,
- reproduce Euphemia outcomes,
- support welfare or counterfactual analysis.
Data Sources
- ENTSO-E Transparency Platform
- NESO (UK)
- Nationaal Energie Dashboard (NL)
License
This document is licensed under the
Creative Commons Attribution 4.0 International (CC BY 4.0).
© Joannes Laveyne, 2025
https://creativecommons.org/licenses/by/4.0/